Mifid 2 requires 4 costs breakdowns.
- Cost breakdown by type
- Illustration of PL effect of costs on account level
- Illustration of PL effect of costs on instrument level
- Total costs incurred per trade
The first 3 of these items can be done using the aggregated Amounts endpoint.
The last needs a combination of data from Trades and Bookings.
The below examples can be seen done in Excel in the sample file here:
Costs breakdown by type:
Mifid 2 only asks that amounts are broken down into high level categories; however, it furthermore states that these amounts shall be broken down for clients upon request, and for that reason it is easier to do the breakdown upfront.
In order to do a breakdown in Clientcurrency we need to use 4 columns from the returned data:
- AmountClass
- AmountSubClass
- AmountType
- AmountClientCurrency
By grouping the the AmountInClientcurrency by AmountClass, AmountSubClass and AmountType, and then splitting the amounts our per quarter we get the following table:
| Row Labels | 2015-1 | 2015-2 | 2015-3 | 2015-4 | 2016-1 | 2016-2 | 2016-3 | 2016-4 | 2017-1 | 2017-2 | 2017-3 | 2017-4 | Grand Total | ||
| OngoingCharges | -21 | -85 | -45 | -44 | -35 | -17 | -43 | -88 | -61 | 0 | -12 | 0 | -452 | ||
| InstrumentRelated | -21 | -63 | -32 | -44 | -26 | -17 | -1 | -5 | -10 | -6 | -224 | ||||
| CFD Finance | -21 | -63 | -32 | -44 | -26 | -17 | -1 | -5 | -10 | -6 | -224 | ||||
| NonBookedCosts | 8 | 8 | |||||||||||||
| Fx-RollOver | 8 | 8 | |||||||||||||
| NonInstrumentRelated | -23 | -14 | -9 | -17 | -27 | -87 | -56 | 0 | -1 | -2 | -235 | ||||
| Interest | -23 | -14 | -1 | 0 | -2 | 0 | -11 | 0 | -1 | -2 | -54 | ||||
| Service Billing Amounts | -8 | -16 | -25 | -87 | -45 | -181 | |||||||||
| TransactionCosts | -189 | -45 | -400 | -506 | -428 | -136 | -394 | -770 | -211 | -277 | -126 | -243 | -3,724 | ||
| InstrumentRelated | -189 | -45 | -400 | -506 | -428 | -136 | -394 | -770 | -211 | -277 | -126 | -215 | -3,696 | ||
| Commission | -182 | -45 | -368 | -499 | -422 | -122 | -376 | -762 | -211 | -272 | -126 | -215 | -3,599 | ||
| Exchange Fee | -7 | -32 | -7 | -7 | -14 | -18 | -8 | -4 | 0 | -97 | |||||
| NonBookedCosts | -28 | -28 | |||||||||||||
| CFD Markup | -16 | -16 | |||||||||||||
| CurrencyConversion | -1 | -1 | |||||||||||||
| Fx Spread | -11 | -11 | |||||||||||||
| Grand Total | -210 | -130 | -445 | -550 | -464 | -152 | -437 | -859 | -272 | -277 | -137 | -243 | -4,175 | ||
We will also need the Total Costs as a percentage of average account value in the period.
In order to do that we will calculate the average account value in the period using two calculated amounts : -3 & -4 ( Cash balance and Positions values)
The calculation is done by taking the average value of the Sum of the two amounts:
in other words to get it for first quarter 2015:
Acount Value on day = sum( Cash balance +Position Values) where date = 2015-01-01
Average account value= Average( Account Value) where month in (1,2,3) and Year = 2015
In order to get the cost as a percentage of the average account values we simply divide the two numbers.
Cost percentage in quarter= Total cost in Quarter/Average Account Value
This gives us the following table
| Cost Schedule | 2015-1 | 2015-2 | 2015-3 | 2015-4 | 2016-1 | 2016-2 | 2016-3 | 2016-4 | 2017-1 | 2017-2 | 2017-3 | 2017-4 |
| OngoingCharges | -21 | -85 | -45 | -44 | -35 | -17 | -43 | -88 | -61 | 0 | -12 | 0 |
| TransactionCosts | -189 | -45 | -400 | -506 | -428 | -136 | -394 | -770 | -211 | -277 | -126 | -243 |
| Total Cost | -210 | -130 | -445 | -550 | -464 | -152 | -437 | -859 | -272 | -277 | -137 | -243 |
| Average Account Value | 8,237 | 8,665 | 7,906 | 6,545 | 2,314 | 1,842 | 6,074 | 10,485 | 2,766 | 5,274 | 2,102 | 1,925 |
| Cost Percentage | -2.5% | -1.5% | -5.6% | -8.4% | -20.0% | -8.3% | -7.2% | -8.2% | -9.8% | -5.3% | -6.5% | -12.6% |
This is equal to to what is shown in SaxoTraderGo Portfolio report:
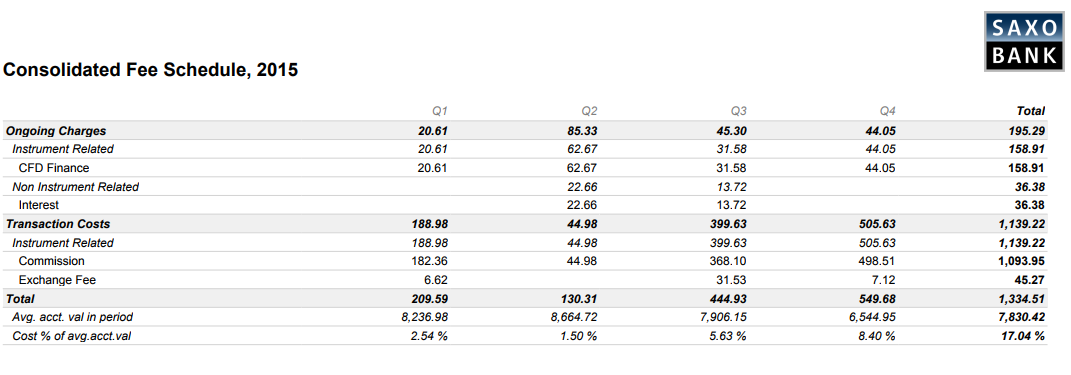
Illustration of PL effect of costs on account level
To do a chart of PL effect of costs on account level we first need a PL chart
PnL Chart:
- filter data to only return AmountTypeId = -5 (PnL)
- Remove data where assetType = 'CM' and where Assettype = '' and where AssetType = 'IC'
- Group and sum values by date in either Account or Client currency
This returns a list of the Pnl per date and can also be done per assettype, Instrument, Month etc.
Once we have the Pnl Chart we need the costs per day:
These are found by summing all amounts where AmountType = 'TransactionCosts' or AmountType = 'OngoingCharges'
Once these are done we can create the following table where the PnL is summarized cumulatively together with the PnL excl Cost:
| Date | PnL | OngoingCharges | TransactionCosts | Cumulative PL | Cumulative PL ex costs |
| 2015-01-02 | -338.39 | 0 | 0 | -338.39 | -338.39 |
| 2015-01-05 | 1643.78 | 0 | 0 | 1305.39 | 1305.39 |
| 2015-01-06 | 521.22 | 0 | 0 | 1826.61 | 1826.61 |
| 2015-01-07 | -979.39 | 0 | 0 | 847.22 | 847.22 |
| 2015-01-08 | -1810.34 | 0 | 0 | -963.12 | -963.12 |
| 2015-01-09 | 1054.63 | 0 | 0 | 91.51 | 91.51 |
| 2015-01-12 | 1486.58 | 0 | 0 | 1578.09 | 1578.09 |
| 2015-01-13 | 397.08 | 0 | 0 | 1975.17 | 1975.17 |
| 2015-01-14 | 1264.98 | 0 | 0 | 3240.15 | 3240.15 |
| 2015-01-15 | 293.83 | 0 | -44.77 | 3533.98 | 3578.75 |
| 2015-01-20 | 121.46 | 0 | -77.42 | 3655.44 | 3777.63 |
| 2015-01-21 | -63.99 | 0 | 0 | 3591.45 | 3713.64 |
| 2015-01-22 | 223.86 | 0 | 0 | 3815.31 | 3937.5 |
| 2015-01-23 | 3.02 | 0 | 0 | 3818.33 | 3940.52 |
| 2015-01-26 | -345.48 | 0 | 0 | 3472.85 | 3595.04 |
| 2015-01-27 | -73.76 | 0 | 0 | 3399.09 | 3521.28 |
| 2015-01-28 | -255.16 | 0 | 0 | 3143.93 | 3266.12 |
| 2015-01-29 | -93.18 | 0 | 0 | 3050.75 | 3172.94 |
| 2015-01-30 | 30.7 | 0 | 0 | 3081.45 | 3203.64 |
And a chart illustrating cost effect on Pnl ( from Saxo Portfolio report)
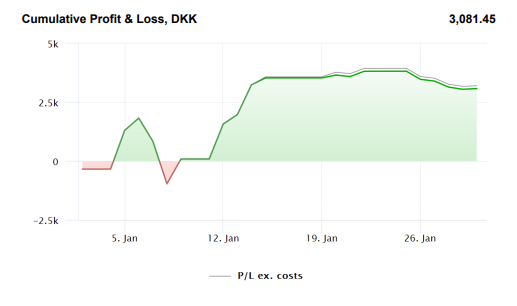
Illustration of PL effect of costs on instrument level
To do a table with PL effect of costs on Instrument level we first need PL per instrument
PnL Chart:
- filter data to only return AmountTypeId = -5 (PnL)
- Remove data where assetType = 'CM' and where Assettype = '' and where AssetType = 'IC'
- Group and sum values by instrument in either Account or Client currency
This returns a list of the Pnl per instrument asplit into assettype if needed.
Once we have PnL per instrument we need to find the costs associated with each instrument in the period:
This is done by summing all aggregatedAmounts for the instrument where AmountType = 'TransactionCosts' or AmountType = 'OngoingCharges'
To the the PnL Ex costs, we simply subtract the costs ( these are usually negative so PnL ex Costs should be larger than PnL).
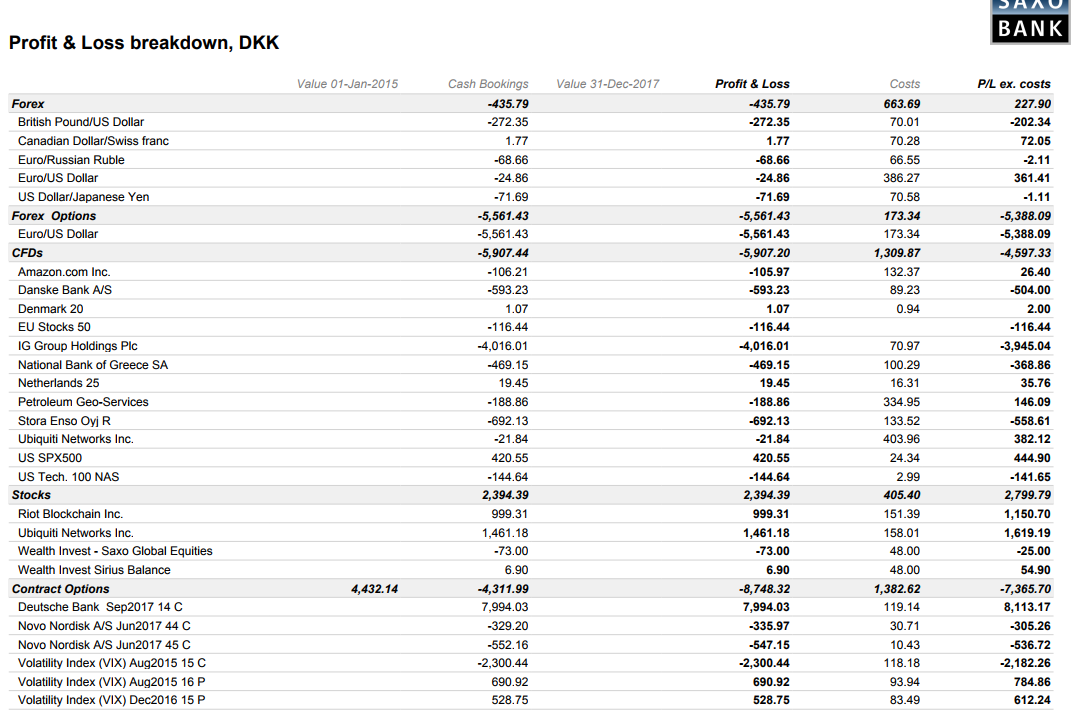
This leads to a table with the following format:
| Row Labels | Sum of AmountClientCurrency | OngoingCharges | TransactionCosts | PL | PL ex costs |
| Amazon.com Inc. | -105.97 | -6.70 | -125.67 | -105.97 | 26.40 |
| British Pound/US Dollar | -272.35 | 0.00 | -70.01 | -272.35 | -202.34 |
| Canadian Dollar/Swiss franc | 1.77 | 0.00 | -70.28 | 1.77 | 72.05 |
| Danske Bank A/S | -593.23 | -10.23 | -79.00 | -593.23 | -504.00 |
| Denmark 20 | 1.25 | 0.00 | -0.75 | 1.25 | 2.00 |
| Deutsche Bank Sep2017 14 C | 7,994.03 | 0.00 | -119.14 | 7,994.03 | 8,113.17 |
| EU Stocks 50 | -116.44 | 0.00 | 0.00 | -116.44 | -116.44 |
| Euro/Russian Ruble | -68.66 | 7.66 | -78.54 | -68.66 | 2.22 |
| Euro/US Dollar | -5,586.29 | 0.00 | -559.61 | -5,586.29 | -5,026.68 |
| IG Group Holdings Plc | -4,016.01 | 0.00 | -70.97 | -4,016.01 | -3,945.04 |
| National Bank of Greece SA | -469.15 | -10.51 | -89.78 | -469.15 | -368.86 |
| Netherlands 25 | 19.45 | -5.81 | -10.50 | 19.45 | 35.76 |
| Novo Nordisk A/S Jun2017 44 C | -335.97 | 0.00 | -30.71 | -335.97 | -305.26 |
| Novo Nordisk A/S Jun2017 45 C | -547.15 | 0.00 | -10.43 | -547.15 | -536.72 |
| Petroleum Geo-Services | -188.86 | -26.38 | -308.57 | -188.86 | 146.09 |
| Riot Blockchain Inc. | 999.31 | 0.00 | -151.39 | 999.31 | 1,150.70 |
| Stora Enso Oyj R | -692.13 | -6.27 | -127.25 | -692.13 | -558.61 |
| Ubiquiti Networks Inc. | 1,439.34 | -131.90 | -430.07 | 1,439.34 | 2,001.31 |
| US Dollar/Japanese Yen | -71.69 | 0.00 | -70.58 | -71.69 | -1.11 |
| US SPX500 | 420.55 | -23.30 | -1.05 | 420.55 | 444.90 |
| US Tech. 100 NAS | -144.64 | -2.99 | 0.00 | -144.64 | -141.65 |
| Volatility Index (VIX) Aug2015 15 C | -2,300.44 | 0.00 | -118.18 | -2,300.44 | -2,182.26 |
| Volatility Index (VIX) Aug2015 16 P | 690.92 | 0.00 | -93.94 | 690.92 | 784.86 |
| Volatility Index (VIX) Dec2016 15 P | 528.75 | 0.00 | -83.49 | 528.75 | 612.24 |
| Volatility Index (VIX) Feb2017 18 C | -4,226.86 | 0.00 | -63.30 | -4,226.86 | -4,163.57 |
| Volatility Index (VIX) Jan2015 15.000 C | 3,533.98 | 0.00 | -44.77 | 3,533.98 | 3,578.75 |
| Volatility Index (VIX) Jan2016 20 P | -4,742.28 | 0.00 | -89.23 | -4,742.28 | -4,653.05 |
| Volatility Index (VIX) Jan2017 16 C | -5,891.67 | 0.00 | -86.09 | -5,891.67 | -5,805.58 |
| Volatility Index (VIX) Jul2016 17 P | 1,528.12 | 0.00 | -93.70 | 1,528.12 | 1,621.82 |
| Volatility Index (VIX) Jun2016 20 C | -2,031.65 | 0.00 | -46.58 | -2,031.65 | -1,985.07 |
| Volatility Index (VIX) May2016 19 C | -1,169.15 | 0.00 | -43.18 | -1,169.15 | -1,125.97 |
| Volatility Index (VIX) May2016 22 C | -738.24 | 0.00 | -43.16 | -738.24 | -695.08 |
| Volatility Index (VIX) Nov2016 15 P | 914.24 | 0.00 | -83.12 | 914.24 | 997.35 |
| Volatility Index (VIX) Oct2016 15 C | -991.21 | 0.00 | -43.96 | -991.21 | -947.25 |
| Volatility Index (VIX) Oct2017 10 P | -377.81 | 0.00 | -205.08 | -377.81 | -172.73 |
| Volatility Index (VIX) Oct2017 11 C | -64.23 | 0.00 | -40.73 | -64.23 | -23.50 |
| Volatility Index (VIX) Sep2016 24 C | -521.70 | 0.00 | -43.84 | -521.70 | -477.86 |
| Wealth Invest - Saxo Global Equities | -73.00 | 0.00 | -48.00 | -73.00 | -25.00 |
| Wealth Invest Sirius Balance | 6.90 | 0.00 | -48.00 | 6.90 | 54.90 |
| Total | -18,258.16 | -216.43 | -3,722.64 | -18,258.16 | -14,319.10 |
Which compares to the overview found in Saxo Portolio report
Settlement Note:
The settlement note is a legal requirement from Pre mifid 2, but the requirements have been enchanced with Mifid2 especiallt around costs.
It consists of a combination of trade information ( price, amount, direction, exchange etc) and Bookings related to the trade ( P/L, Share amounts, Commission, stamp duty etc).
The trade level data also includes the spread or markup on FX and CFDs while the bookings include the currency conversion incurred per booking when trading instruments in currency different from the account currency.
In order to construct the Settlement Note trade related details need to be taken from Trades endpoint.
Using the trade id found in the trades endpoint, the bookings endpoint can be queried to attain all related bookings.
In order to calculate the total costs for the trade we need to add together:
- (Bookings endpoint) Sum of all bookings classified via AmountType as "transactioncost" ( same method as for aggregated amountd) this will ignore PL bookings and share amounts etc.
- (bookings endpoint) Sum of currency conversion for all bookings for the trade, including bookings not classified as transactioncosts
- (Trades endpoint) Spread/Markup
| Tradedate | TradeId | instrument | BuySell | Amount | Price | Traded Value | Booked Amount (Acc CCY) | Spread/markup (Client ccy) | Currency conversion cost ( client ccy) | Other Trade Costs | Total Costs |
| 2016-05-27 | 953294941 | Dong Energy A/S | TransferIn | 1.00 | 0.00 | 0.00 | 0.00 | 0.00 | 0.00 | 0.00 | 0.00 |
| 2016-06-03 | 955820682 | Euro/US Dollar | Sold | -5000.00 | 1.11 | 5,569.90 | -2.21 | -0.33 | -0.01 | -2.21 | -2.55 |
| 2016-06-03 | 955850636 | Euro/US Dollar | Bought | 5000.00 | 1.12 | -5,599.40 | -199.16 | -14.40 | -0.99 | -2.27 | -17.66 |
| 2016-06-03 | 955903347 | Euro/US Dollar | Sold | -5000.00 | 1.12 | 5,624.00 | -2.26 | -0.98 | -0.01 | -2.26 | -3.25 |
| 2016-06-03 | 955977063 | Euro/US Dollar | Bought | 5000.00 | 1.13 | -5,649.15 | -168.67 | -0.49 | -0.84 | -2.25 | -3.58 |
| 2016-06-03 | 956069796 | Dong Energy A/S | TransferOut | -1.00 | 0.00 | 0.00 | 0.00 | 0.00 | 0.00 | 0.00 | 0.00 |
| 2016-06-13 | 959955753 | Volatility Index (VIX) Jun2016 20 C | Bought | 2.00 | 1.50 | -300.00 | -2031.65 | 0.00 | -10.10 | -46.58 | -56.68 |
| 2016-06-13 | 959963070 | Volatility Index (VIX) Jul2016 17 P | Bought | 2.00 | 1.20 | -240.00 | -1635.58 | 0.00 | -8.14 | -46.61 | -54.75 |
| 2016-06-24 | 964726344 | Euro/US Dollar | Bought | 10000.00 | 0.01 | -102.90 | -723.77 | -126.12 | -0.72 | -33.54 | -160.38 |
| 2016-06-29 | 967148917 | Volatility Index (VIX) Jun2016 20 C | Sold | -2.00 | 0.00 | 0.00 | 0.00 | 0.00 | 0.00 | 0.00 | 0.00 |
| 2016-07-08 | 972397964 | Volatility Index (VIX) Jul2016 17 P | Sold | -2.00 | 2.40 | 480.00 | 3163.70 | 0.00 | -15.90 | -47.09 | -62.99 |
| 2016-07-18 | 978021282 | US Tech. 100 NAS | Bought | 1.00 | 4621.76 | -4,621.76 | 0.00 | 0.84 | 0.00 | 0.00 | 0.84 |
| 2016-07-18 | 978022359 | Volatility Index (VIX) Sep2016 24 C | Bought | 1.00 | 1.05 | -105.00 | -732.74 | 0.00 | -3.64 | -23.77 | -27.41 |
| 2016-07-19 | 978244460 | US Tech. 100 NAS | Sold | -1.00 | 4599.98 | 4,599.98 | -147.24 | 0.84 | -0.74 | 0.00 | 0.10 |
| 2016-07-21 | 979930444 | Volatility Index (VIX) Oct2016 15 C | Bought | 1.00 | 4.70 | -470.00 | -3215.59 | 0.00 | -16.00 | -23.90 | -39.90 |
| 2016-08-05 | 986301769 | US SPX500 | Sold | -1.00 | 2178.79 | 2,178.79 | 0.00 | 0.50 | 0.00 | 0.00 | 0.50 |
| 2016-08-05 | 986302575 | US SPX500 | Bought | 1.00 | 2179.17 | -2,179.17 | -2.57 | 0.50 | -0.02 | 0.00 | 0.48 |
| 2016-08-05 | 986310062 | US SPX500 | Bought | 1.00 | 2180.63 | -2,180.63 | 0.00 | 0.50 | 0.00 | 0.00 | 0.50 |
| 2016-08-08 | 986449481 | US SPX500 | Sold | -1.00 | 2181.15 | 2,181.15 | 3.47 | 0.50 | -0.02 | 0.00 | 0.48 |
| 2016-08-08 | 986827453 | US SPX500 | Bought | 3.00 | 2181.67 | -6,545.01 | 0.00 | 1.52 | 0.00 | 0.00 | 1.52 |
| 2016-08-09 | 987298895 | US SPX500 | Sold | -3.00 | 2185.00 | 6,555.00 | 66.51 | 1.51 | -0.33 | 0.00 | 1.18 |
Which allow us to construct the following:
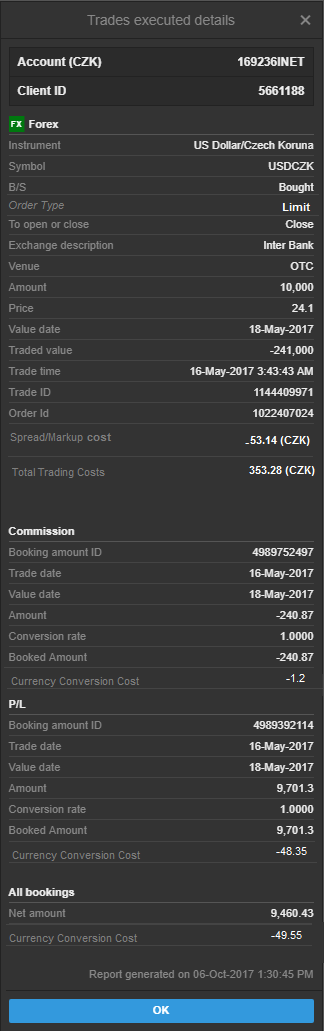
See also the live sample on showing costs of a trade (with source).