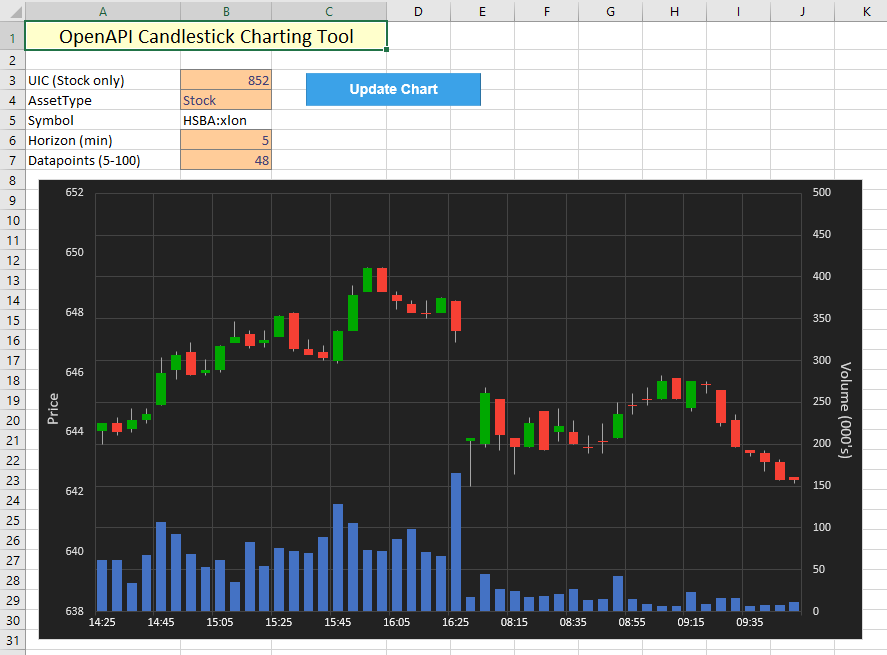
Tutorial 2 introduced the /chart/v1/charts/ endpoint, which was used to pull closing FX bid prices for the required horizon and datapoint combination. In this tutorial, we revisit charting functionality by expanding the basic line chart to the well-known OHLC chart, or Candlestick Chart. The goal is to attempt to recreate the charts on SaxoTraderGO as closely as possible and introduce an additional measure: volume, which is usually displayed as a histogram at the bottom. In addition, because the focus is on creating a chart for stocks in this tutorial, some elements of the API call have to be adjusted. Excel has a very helpful chart datatype called Volume-open-high-low-close, which takes care of assigning the correct series to each chart element. The result looks as follows:
By default, Saxo Developer Accounts do not have access to pricing data for stocks (in fact, this instrument is disabled altogether). In order to enable additional instruments on your account, please reach out to openapisupport@saxobank.com.
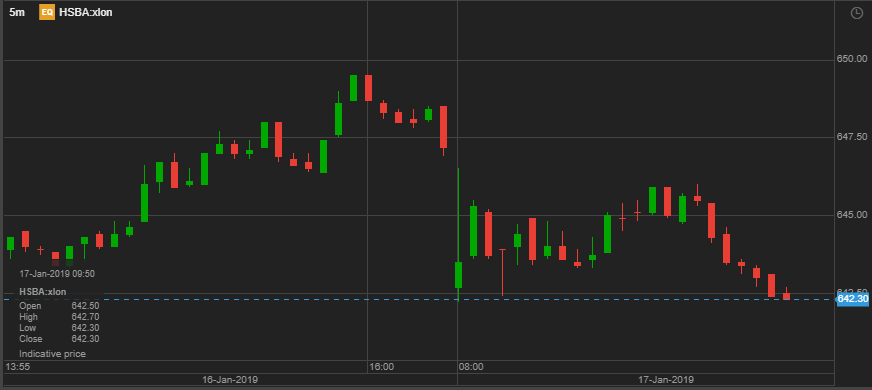
With some styling, the candle chart replicates the chart on GO fairly closely:
VBA implementation
As before, we use some basic VBA to automatically pull the latest OHLC & volume datapoints from the OpenAPI. The procedure for updating the chart is the same as we used in Tutorial 2, except that we are now using 5 series of datapoints (excluding the dates) instead of 1. The API call looks as follows:
query = "/openapi/chart/v1/charts?AssetType=" & AssetType & "&Uic=" _
& Uic & "&Horizon=" & Horizon & "&Time=" & Format(t, "yyyy/mm/dd hh:mm") _
& "&Mode=UpTo" & "&Count=" & Count
fields = "Data[].Time,Data[].Volume,Data[].Open,Data[].High,Data[].Low,Data[].Close"

data = Application.Run("OpenApiGet", query, fields)
And updating the chart is taken of in a similar way as before:
dmax = UBound(data)
Set DataCells = Range("Data!A2:F" & 1 + dmax)
DataCells = data

ActiveSheet.ChartObjects("CandleChart").Activate
ActiveChart.SetSourceData Source:=DataCells