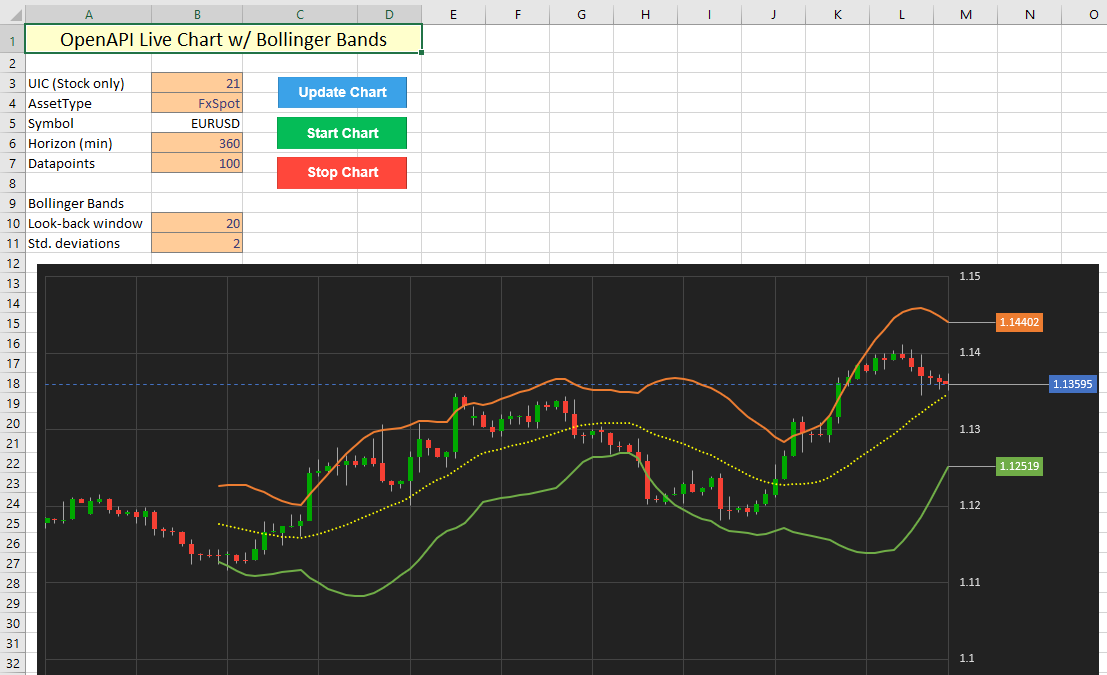
In the previous tutorial, we looked at replicating SaxoTraderGO charts using Excel's built in stock chart tool. One important difference still exists however: the chart is static and needs to be updated manually. Using a similar implementation as in Tutorial 5, we will now attempt to continuously refresh the chart as new data comes in. This sound easier than it is, as Excel will automatically recalculate all of the values that are computed on the Data sheet when we refresh the source data.
This chart features Bollinger Bands, which are fairly simple to recalculate. However, consider a situation where historic chart data is fed into many individual indicators, each of which require numerous components to be calculated separately. Assuming the chart pulls out a maximum of 1200 datapoints, a total of roughly 6000 cells are updated each time only to refresh the underlying data. Depending on the amount of calculations linked to this data, a simple refresh can quickly cascade into a series of updates across many more cells (easily over 20000). This puts serious pressure on Excel, especially considering we would ideally like to update our chart every 3 seconds. In addition, the vast majority of the recalculations is not required, as the historic data does not change (and therefore, any indicators linked to this do not change either). In essence, we are only interested in updating the most recently available value and compute the changes in the indicator values accordingly.
Prechecks
To overcome this issue, we implement a precheck, which pulls out only the latest data from the /charts/ endpoint and compares it against the data that is in the graph. If the timestamp of the horizon on the latest response from the OpenAPI matches the timestamp of the latest data in the chart, we can use some simple VBA logic to only update the latest datapoints. This reduces the amount of recalculations substantially, as Excel will only recompute dependent cells that are linked to the these datapoints.
If the timestamp is different, a full refresh is triggered, which pulls down new data from the OpenAPI for the entire time window. This will only happen once per minute at most (when the horizon is set to 1 minute).
VBA implementation
To achieve the above result, the following bits of VBA are linked up to the buttons labeled Start Chart and Stop Chart:
Sub StartChart()
    'perform checks
    If chartupdate = True Then
        Exit Sub
    End If

    'start automatic updates
    chartupdate = True
    Call AutoUpdateChart

End Sub

Sub StopChart()
    chartupdate = False

End Sub
When the AutoUpdateChart subroutine is called, the following steps are executed:
- Check if routine is still allowed to run.
- Call the precheck subroutine to only pull out the latest datapoints from the OpenAPI.
- If the precheck finds a difference in the timestamps, trigger a full refresh of the chart data.
- Loop this function every 3 seconds.
Sub AutoUpdateChart()

    'only keep updating if chartupdate flag is still true
    If chartupdate = True Then

        'initialize fullupdate flag as False
        fullupdate = False

        fields = "Data[].Time,Data[].OpenBid,Data[].HighBid,Data[].LowBid,Data[].CloseBid"

        'run precheck
        'this function will set the fullupdate flag to true if a full refresh is required
        Call RunPreCheck([Uic], [AssetType], [Horizon], Now, [Max])

        'if full refresh requried, call function
        If fullupdate = True Then
            Call RefreshAllData([Uic], [AssetType], [Horizon], Now, [Max])
        End If

        [Uic].Select

        'loop this function
        IntervalTime = TimeValue("00:00:03")
        Application.OnTime Now() + IntervalTime, "ThisWorkbook.AutoUpdateChart"
    End If

End Sub
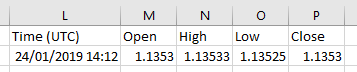
The precheck subroutine performs the usual API calls and error checking that we have implemented in earlier charting tutorials. It also compares the value of the returned timestamp (in cell Data!L2) against the current one (in cell Data!A61). If the value is the same, the last values are updated using the response from the API that is already available on the Data sheet (see image). This vastly reduces the pressure on both the OpenAPI, as we only request a single datapoint unless the current horizon expires, and Excel, because it will recompute the values in row 61 only.
Private Sub RunPreCheck(Uic As Integer, AssetType As String, _
    Horizon As Integer, t As String, Count As Integer)
    'this function checks the timestamp on the latest data from the API
    'if the timestamp is the same ONLY the last line is updated

    Dim checkcells As Range

    If [Symbol] = "Not Found" Then GoTo inputerror

    prequery = "/openapi/chart/v1/charts?AssetType=" & AssetType & "&Uic=" _
    & Uic & "&Horizon=" & Horizon & "&Time=" & Format(t, "yyyy/mm/dd hh:mm") _
    & "&Mode=UpTo" & "&Count=" & 1

    checkdata = Application.Run("OpenApiGet", prequery, fields)

    If TypeName(checkdata) <> "Variant()" Then GoTo unexperror

    Set checkcells = Range("Data!L2:P2")
    checkcells.ClearContents
    checkcells = checkdata

    'check timestamp
    If Range("Data!L2").Value = Range("Data!A61").Value Then
        Range("Data!A61:E61") = checkdata 'only update 1 row if timestamp is the same
    Else
        'set flag to True to trigger entire update of the sheet
        fullupdate = True
    End If

    Exit Sub

inputerror:     'capture input error
    MsgBox "Error: Could not complete request." & vbNewLine & _
    "It looks like that combination of UIC / AssetType does not exist."
    Exit Sub

unexperror:     'capture unexpected error
    MsgBox "An unexpected error occurred." & vbNewLine & _
    "This could be caused by data access rights." & vbNewLine & _
    "Returned error: " & data
    Exit Sub

End Sub
And finally, a full refresh is triggered only when required by the precheck, which sets the fullupdate flag to True. This will recompute all values, which is necessary because all time blocks are 'shifted' as the latest one is added on the top.
Private Sub RefreshAllData(Uic As Integer, AssetType As String, _
    Horizon As Integer, t As String, Count As Integer)

    Dim datacells As Range
    Dim chartdata As Range
    Dim dmax As Integer

    query = "/openapi/chart/v1/charts?AssetType=" & AssetType & "&Uic=" _
    & Uic & "&Horizon=" & Horizon & "&Time=" & Format(t, "yyyy/mm/dd hh:mm") _
    & "&Mode=UpTo" & "&Count=" & Count

    data = Application.Run("OpenApiGet", query, fields)

    Range("Data!A2:E1201").ClearContents

    dmax = UBound(data)
    Set datacells = Range("Data!A2:E" & 1 + dmax)
    datacells = data

    Set chartdata = Range("Data!A2:I" & 1 + dmax)

    ActiveSheet.ChartObjects("CandleChart").Activate
    ActiveChart.SetSourceData Source:=chartdata
    Exit Sub

End Sub